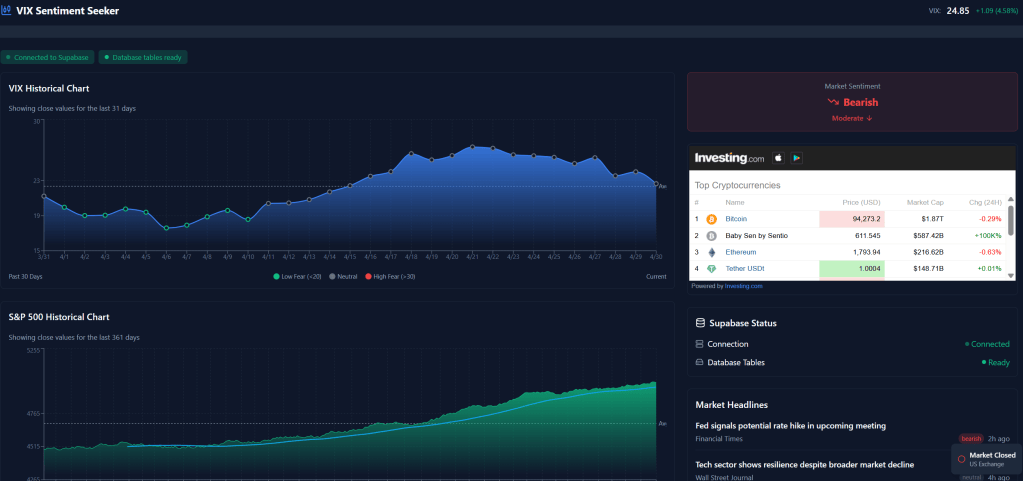
After the US election, number one conversation in the market is Volatility. Markets have experienced ups and downs in a frequency rarely seen before. In the ever-shifting landscape of financial markets, volatility stands as both a harbinger of risk and an emblem of opportunity. The CBOE Volatility Index, commonly known as the VIX, serves as a barometer for market sentiment, reflecting the collective anxiety or complacency of investors. But how does one interpret this elusive metric? Enter svix.farhad.website, a platform dedicated to unraveling the complexities of the VIX. It is the most accurate tool we have to measure sentiment and volatility,
Understanding the VIX: The Market’s Fear Gauge
The VIX measures the market’s expectation of volatility over the next 30 days, derived from the prices of S&P 500 index options. Often dubbed the “fear index,” a rising VIX indicates increasing investor unease, while a declining VIX suggests growing confidence. However, the VIX is not directly investable; instead, traders turn to instruments like the -1x Short VIX Futures ETF (SVIX) to capitalize on volatility movements.Macrotrends
The stock market doesn’t just move — it jitters, jolts, and sometimes panics. That panic has a name: the VIX — a number that rises when fear grips investors and falls when calm returns. But interpreting the VIX isn’t easy. That’s why I built svix.farhad.website, a modern dashboard that makes volatility visible, understandable, and actionable, especially for people who aren’t hedge fund managers or math wizards.
Let’s walk through what the site does — and why it matters.
What is the VIX — and Why Should You Care?
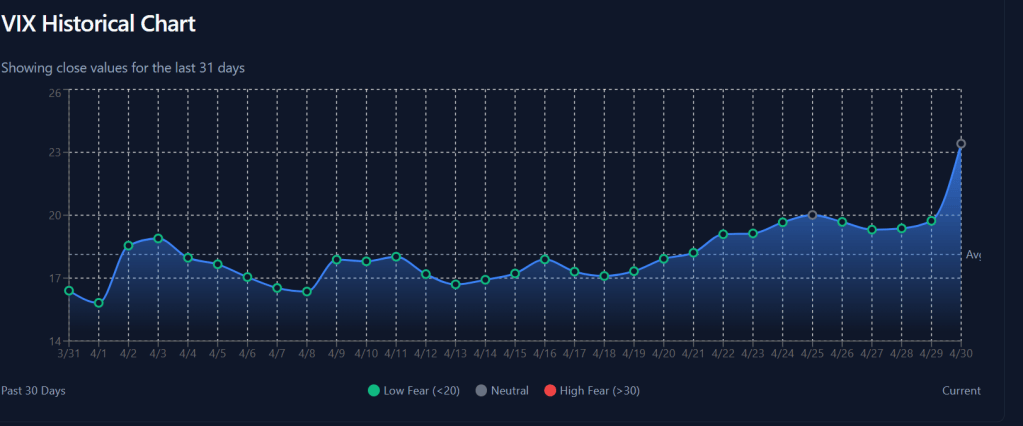
The VIX (Volatility Index) is often called the “fear gauge” of Wall Street. It doesn’t track stock prices. Instead, it tracks how much investors think stocks will move in the near future (typically 30 days). The VIX is calculated from options prices — basically, bets investors make about future market moves.
- A high VIX means investors expect turbulence (like during financial crises or major geopolitical events).
- A low VIX means confidence — or complacency — is back in the driver’s seat.
But here’s the catch: the VIX isn’t something you can buy or sell directly. So traders use derivatives like SVIX — a financial product that moves inversely to the VIX — to speculate on or hedge against volatility. And that’s where my platform steps in.
VIX is the most accurate crystal ball to the market. Not always perfect but good enough.
🤖 Leveraging AI for Smarter Decisions
In addition to providing real-time data and visualizations, svix.farhad.website integrates AI-driven tools to enhance your market analysis. By utilizing machine learning algorithms, the platform can detect subtle patterns in market behavior, predict potential volatility shifts, and offer personalized insights based on historical trends. Whether it’s forecasting short-term market movements or analyzing sentiment from global news, AI enables you to make more informed, data-driven decisions. It’s not just about watching the charts — it’s about understanding the hidden forces driving them.
🧰 What svix.farhad.website Actually Does
VIX Sentiment Seeker gives you tools to read the emotional pulse of the market — in real time, with depth. It’s built for traders and financial analysts, but the interface and explanations are simple enough for anyone with a passing interest in markets.
Here’s what you get:
📈 1. Market Indices Dashboard
Quick-glance data on major stock indices like the S&P 500, NASDAQ, and Dow Jones — all with real-time updates. You’ll see both percentage changes and raw point changes, along with color cues to make market movement obvious.
🔍 2. VIX Tools Explained Visually
- Current VIX value with visual movement indicators.
- Historical VIX charts — zoom in on past panic periods (e.g. March 2020) or study calm intervals.
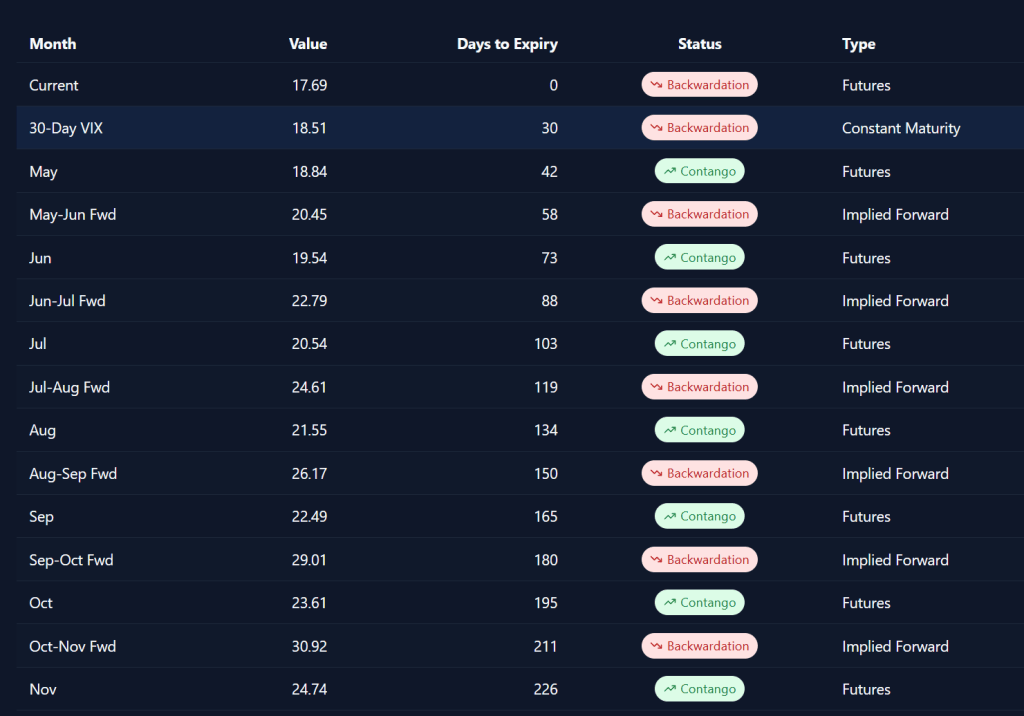
- VIX Term Structure — this one’s tricky, but vital. It shows how the price of volatility futures change with time. Is next month more uncertain than this month? That curve tells you.
- Contango: Future prices > current prices → calm market.
- Backwardation: Future prices < current → storm clouds.
📊 3. S&P 500 Analysis
- Overlay Simple Moving Averages (SMA) on price charts to spot trends.
- 10-day SMA: Short-term trend
- 20-day SMA: Medium-term trend
- View clean, sortable data tables for price breakdowns.
🕰 4. Market Status Tracker
Markets open? Closed? Holidays? The platform tells you in plain English, factoring in real-world trading hours.
⚙️ What’s Under the Hood?
You won’t see it, but the platform is built on a fast, modern tech stack:
- Frontend: React + TypeScript + TailwindCSS
- Data handling: Recharts, React Query, real-time API feeds
- Backend: Supabase for storage, multiple financial data APIs (FMP, Tiingo, Finnhub), web scraping for exotic data when APIs fall short
This setup allows fast performance (under 2s page loads), resilient fallbacks when APIs glitch, and clean visualizations even with heavy data loads.
🧩 Glossary for the Non-Wall-Streeters
- VIX: A number that reflects expected stock market volatility in the next 30 days.
- SVIX: An ETF (exchange-traded fund) that gains when the VIX goes down — used to bet on calm.
- SMA (Simple Moving Average): The average price over X days, used to spot trends.
- Contango / Backwardation: Describes the shape of the volatility futures curve — important for understanding risk.
- Term Structure: How volatility is priced over different time horizons — key for professional traders.
Final Word
In markets, timing is everything — and sentiment drives timing. svix.farhad.website gives you a compass in the chaos. Whether you’re investing $500 or managing a portfolio, this tool brings clarity where there’s usually just noise.
This is just experiment and do not use it as financial advice.


Leave a Reply